
SRE Methods and Climate Change
Table of contents
Site Reliability Engineering’s goal is to ensure that software systems and services that are created in an organization are made to evolve easily and especially to be extremely reliable.
To do that, many aspects of software engineering are applied to infrastructure topics. Those methods are born at Google and are increasingly popular since the release of the book “Site Reliability Engineering” in 2016.
DevOps, SRE, what’s the difference ?
As we have used some buzzwords, let’s make it clearer before we move forward. If you are already familiar with DevOps and SRE methods, you can jump to the next section.
The SRE “framework” shares some principles with the DevOps movement:
- Change is necessary to improve: adopting DevOps or SRE methods is really the opposite of V-model or infrastructure freezes. In both cases, identifying the improvements to make, perform the appropriate changes and learn from mistakes are key to achieve more velocity (DevOps), quality and reliability (SRE).
- Break down silos : in opposition to the world described in the IT crowd TV show, DevOps and SRE pricniples encourage a tight and frequent collaboration between developpers team, product team and infrastructure team, at almost every step of a project. SRE books even talk about “shared ownership model”. In this context, product owners and managers are as much responsible (so invested) as the developpers and SREs, regarding the deployment of a new release.
- Small, frequent changes are better than big developments taking months. This permits to achieve more reliability, especially if every chang is tested automatically, contributing to the feedback loop.
- Outages or failures are never only one person’s responsibility: it is extremely important to understand the systemic explanation of an issue (the dangerous button in the interface is not red enough and we don’t ask the user if he is sure about triggering the action), rather than looking for someone to blame (this is because of the user)
Both movements are very close so each other. Some people even consider that SRE is an implementation of the DevOps patterns, applied to infrastructure topics. One difference is that SRE can be a job in itself (Site Reliability Engineer), where DevOps is only a movement or a set of best practices.
SLI, SLO and the error budget
I’d like to tell you about a particular element in the SRE methods: the famous SLI and SLO, which stands for Service Level Indicator and Service Level Objectivs. Those are methods to choose which metrics are important for the success of a project during all its lifecycle.
A Service Level Indicator is most of the time a ration beween two numbers, one being the number of “positive” events, the other one being the total number of events. Here a few examples of SLIs:
The Service Level Indicator is most of the time a ratio of two numbers. First number is the number of positive events, the other one the total number of events of the same kind. Here are some SLI examples:
- number of successful HTTP requests / total number of HTTP requests
- number of requests on a datastore that got an answer in less than 2 seconds / total number of requests on this datastore
- number of gRPC calls on my service that succeeded in less than 80 milliseconds / total number of gRPC calls on that service
A key point here is that an SLI is supposed to measure the customer satisfaction (when human) or the efficiency of the response to the client (when the client is a machine). That’s why SLIs are more often about perceived errors than about how memory is consumed on a server, for example.
The second important thing I wanted to talk about is the Service Level Objective. It’s simply an objective to reach on an SLI, either on a floating or calendar-based a time window. That objective has to be collaboratively defined by the product team, the production team and the developpers. That objective success has to be owned by someone with enough power to assume tradeoffs between velocity (speed at which features are deployed) and reliability. It can be the CTO, in a small structure, or the product owner/manager in a bigger structure.
The difference between 100% (of “good” events for the SLI) and the SLO (let’s say 97% of requests getting a response in less than 50ms) is called the error budget. If the number of “bad” events (impacting the probability to reach the SLO) lowers the SLI below the SLO on the choosen time window, the error budget is exhausted. In this case we can either, redesign the technical stack or the product to reach the SLO on the next period, or redefine the SLO if it was simply too ambitious (a SLO of 100% being a bad idea most of the time).
As you can imagine, having a proper monitoring and alerting of the health of the error budget is essential. Those pointers become then a main attention point for developpers, infrastructure people (Site Reliability Engineers) but also and especially product persons. We could then create a dashboard with the SLIs and the state of error budgets consumption, that will be accessible by all the concerned teams or squads.
The asset of this method is that it encourages the product, infrastructure and development teams to collaborate on the same objective, which is most of the time the client satisfaction.
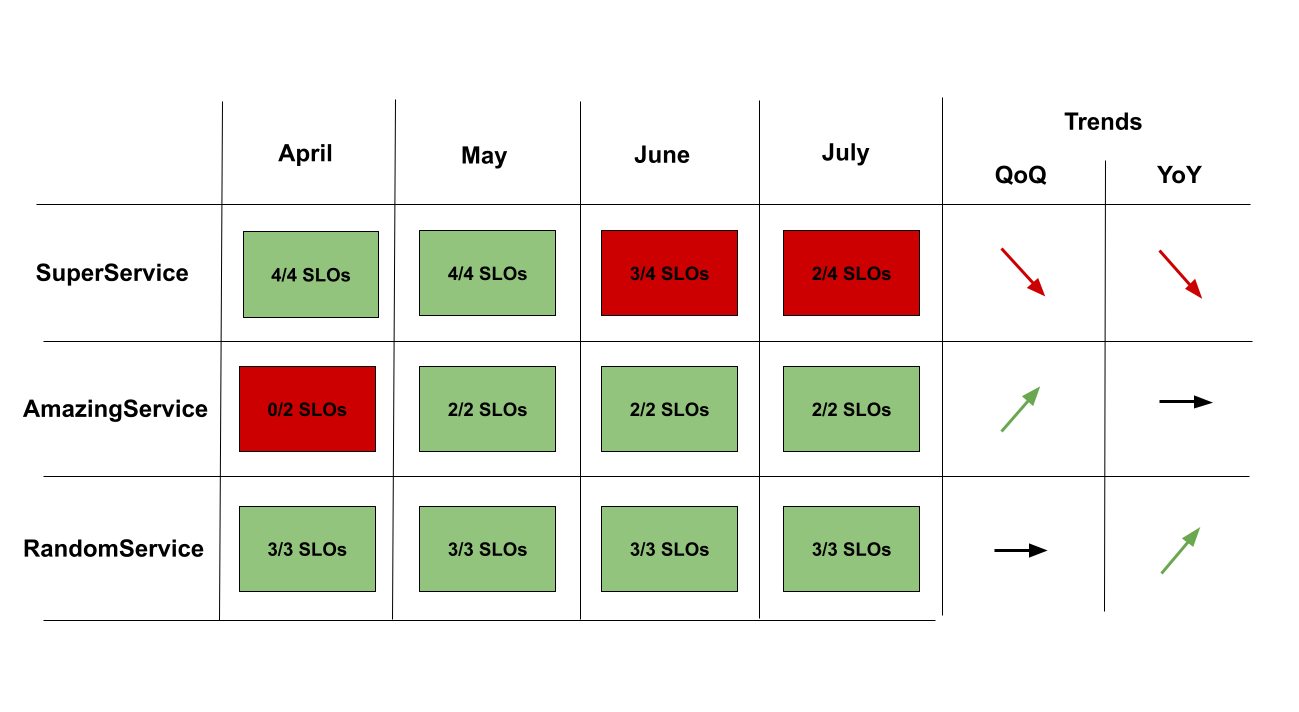
Once those principles are applied to several tech services in the organization, it’s possible to generate a dashboard showing the state of SLO’s for each of those services. This dashboard could then be used as a communication tool to talk with the management and direction, to ask for instance:
- to hire: “we defined and optimized our objectives but we could’nt match all of them because it’s too much work regarding the staffing”
- tradeoffs: “holding a satisfying reliability level on service X requires time that we cannot spend on other services with much higher business value, is this service still accurate on a business perspective ?”
Redefining reliability
There are several definitions of reliability, one being: “reliability is the ability for a system to fulfill a mission in some defined conditions, for a given period of time”. This definition allows to redefine the conditions that dictate if the system did actually fulfill its mission on the given period of time.
As the tech industry has to lower its Green House Gas emissions of 45% in the next 10 years to match Paris agreement objectives, it seems essential to me that a tech service or system is considered reliable, not only if it satisfies the client on the short term, but also if it doesn’t contribute to jeopardize the client’s future. That means obviously, that it has to respect objectives smartly defined regarding GHG emissions related to it’s very existence and usage.
Adoption of SRE is increasing and the framework it provides is really interesting, as it encourages plain collaboration between tech and product teams. As brillantly said Alexis Nicolas during a recent webinar, mitigating climate change is like an escape game that we are all participating to, whether we want it or not.
If I participate to an escape game in which failure means a real danger for my surroundings and myself, I’d prefer to have a dynamic help to solve the challenges, alarms if I spend to much time on less important items and a team fully commited, transparently collaborating on the same objective. Don’t you ?
How to get those metrics ?
How to get dynamic metrics, frequently updated, regarding the impact of a tech service on the climate ? How to measure the result of efforts and actions on that topic ? There are very important things regarding this impact that are hardly measurable (Life Cycle Assesments experts know a lot about it): the production of user devices that will be used to access the service, the production of servers and network, the one of datacenters and their maintenance, how much oil is burned every year just to be sure that the oil based backup is effecttive when needed (or simply to avoid wasting oil once it’s obsolete).
There are other metrics that could be retrieved right now. Power consumption of servers and services they host, are one. It’s then possible to watch and shrink the cut of power consumption in the climate impact of the service, but also to automatically fill some of the scope 2 of a Life Cycle Assessment.
Scaphandre is a solution that enables that. It’s simply an open-source and light monitoring daemon, dedicated to power consumption metrics. It fits easily in an existing monitoring toolchain. It’s extensible and designed to easily integrate new exporters. The idea is Scaphandre has to adapt to your infrastructure, not the other way around. It already permits to store the data in Prometheus, Riemann and very soon in Warp10. This enables you to be very flexible when defining your SLIs and SLO regarding your service’s impact on climate change.
We could then go further and extend those metrics by estimating the GHG emissions associated to it, by leveraging an API like co2signal, another product from Tomorrow, the company behind ElectricityMap.
Conclusion
This is one way to estimate the GHG emissions, per request or per user (leveraging metrics coming from APMs or other monitoring toolchains). Then we can define and setup SLOs like:
- 95% of requests on the API lead to emissions lower than 0.4g eCO2, each month
- 98% of users on the service, lead to a cumulated power consumption lower than 200Wh, each month
Numbers are here completely arbitraty and don’t mean much out of context. However, tracking such indices, collaboratively defined thanks to a global impact estimation, seems like an efficient strategy to lower the footprint of tech services on the long run. This approach is of course complementary with LCAs taking hardware related metrics into account.
The role of eco-conception and sustainability best practices in the desing of tech services is very important. Such service have a growing complexity and the estimation of their impact is a bit more difficult every day. A bottom-up approach like the one introduced in this post is essential (even if not enough) to allow continuous improvements, at scale.